Traffic Safety Report Cards
What’s the State of Safe Streets in Your Neighborhood?
Every 15 hours on average, someone is taken to San Francisco General Hospital after being severely injured in a traffic crash. In 2022, 37 people lost their lives in traffic crashes in San Francisco. That’s because many of San Francisco’s streets are dangerous, especially for people walking. There are around 160 miles of streets designated as ‘high-injury’ because crashes happen so frequently.
Since 2014, the City has made notable progress in redesigning many high-injury streets to better protect pedestrians and bicyclists, plus bring down driver speeds. But dozens of miles have yet to receive any safety improvements.
What are the most dangerous streets where you live? How many people have been hurt or killed in your district?
Read your traffic safety report card to find out. You’ll see what the City is doing and where they’ve been falling behind. Then email your Supervisor to make traffic safety a priority – and push the City to act faster to save lives.
District-by-District Traffic Safety Report Cards
Walk San Francisco released our first traffic safety report cards in 2019. Our newest report cards, released in February 2023, include all publicly-available crash data through 2022 (learn more).
District 1 (Richmond and Seacliff)
District 2 (Pacific Heights, Presidio, Presidio Heights, and Marina)
District 3 (North Beach, Chinatown, Union Square/Financial District, Russian Hill, Nob Hill, and Telegraph Hill)
District 4 (Outer Sunset)
District 5 (Tenderloin, Japantown, Western Addition, Haight Ashbury, and Hayes Valley)
District 6 (South of Market, Mission Bay, and Treasure Island)
District 7 (Inner Sunset, West Portal, Forest Hill, and Parkmerced)
District 8 (Cole Valley, Duboce Triangle, Castro, Diamond Heights, Noe Valley, and Glen Park)
District 9 (Mission, Bernal Heights, and Portola)
District 10 (Potrero Hill, Bayview-Hunters Point, and Visitacion Valley)
District 11 (Excelsior, Oceanview, and Outer Mission)
Basic Pedestrian Safety Improvements
Add Up to Save Lives

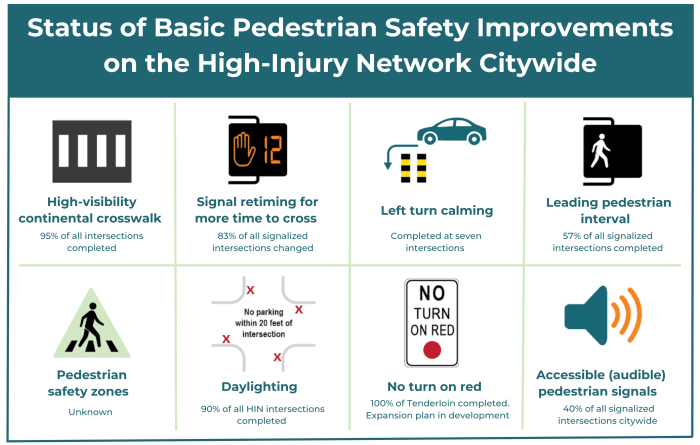
High-visibility continental crosswalks increase the likelihood of a driver yielding to a pedestrian by 30-40%.
40% of traffic fatalities in 2019 involved drivers making left turns according to SFMTA. At intersections in New York City with left turn calming, pedestrian injuries have decreased by 20%.
Leading pedestrian intervals, which give pedestrians a head-start to cross before drivers get the green, can reduce pedestrian-vehicle collisions by as much as 60%.
Pedestrian safety zones use paint and posts to create a buffer between vehicles and pedestrians. The zones shorten the crossing distance plus improve visibility for drivers and pedestrians. Drivers typically make turns 55% slower. This is a cheap, quick way to do what a concrete bulbout does.
Daylighting reduces crashes by up to 30% by creating clear sight lines at intersections.
No turn on red gives pedestrians and drivers separate times to cross, preventing dangerous conflict in the crosswalk. Drivers turning on red account for 20% of traffic crashes (SFMTA).
Accessible pedestrian signals communicate WALK and DON’T WALK with non-visual signals for people who are blind or low-vision.
The high-injury network is the 12% of San Francisco streets where 68% of traffic crashes occur.
Our members’ support made this project possible. If you find our work valuable, please consider a donation to Walk San Francisco.


