What do drivers do after they’re past a speed camera?
San Francisco’s speed cameras have proven highly effective at camera locations
A year and a half in, San Francisco’s speed cameras have proven a powerful solution for changing driver behavior and making everyone safer. The share of drivers speeding 10 MPH or more above the speed limit is down 84% across camera locations. As the #1 cause of severe and fatal crashes in San Francisco, reducing dangerous speeding is crucial for achieving safe streets for all.
But the current state law allowing San Francisco to pilot speed cameras limits the number of locations to just 33 – a far cry from what’s needed given how rampant speeding is citywide. We need drivers to go consistently at safe speeds everywhere, not just here and there.
Walk SF is looking toward new state legislation that would allow more speed cameras in San Francisco, plus allow additional California cities to be able to harness this lifesaving technology.
In considering how many speed cameras San Francisco needs to adequately address those streets with the most dangerous speeding, a key question is: how much does a speed camera influence driver behavior beyond the camera location?
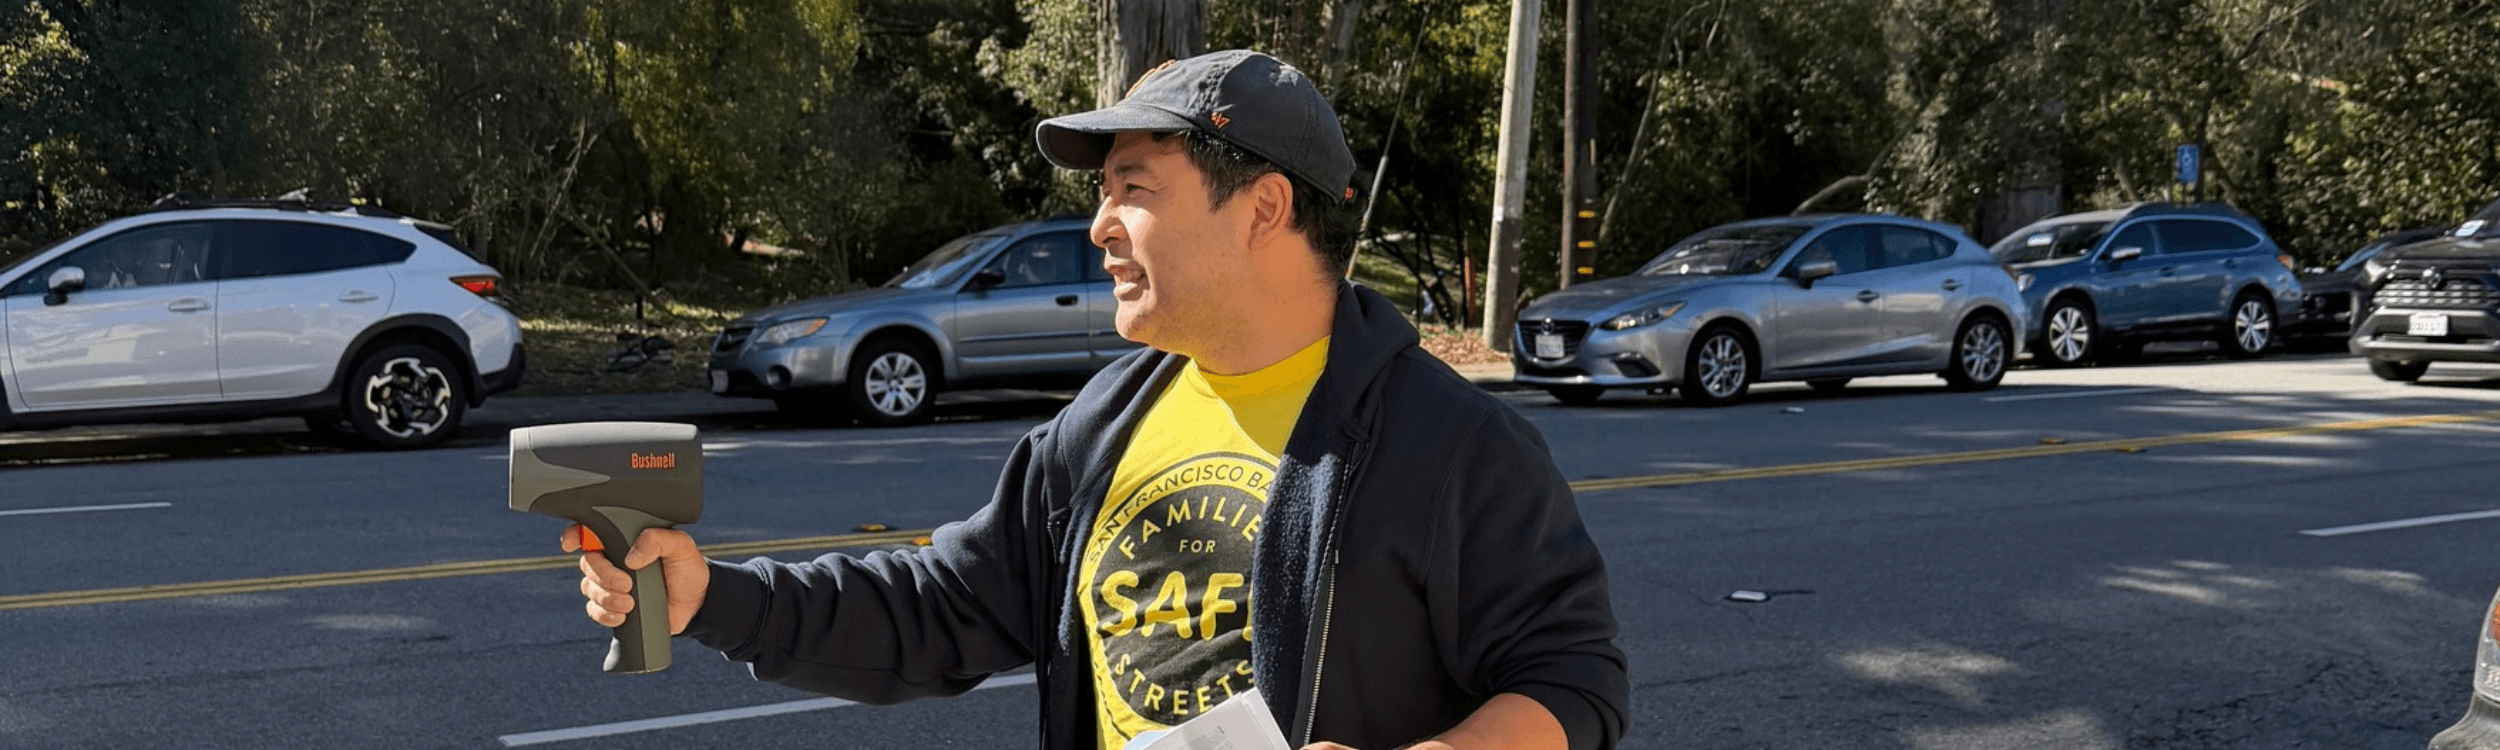
Together with neighbors and members of Families for Safe Streets, we did a speed survey on Fulton Street to explore this question.
Dangerous speeding is frequent on Fulton Street
Fulton Street is a major thoroughfare cutting across the city. For the three miles of Fulton Street running along Golden Gate Park, from Stanyan to the Great Highway, the street has two lanes running in each direction. This street design, like other wide, multi-lane streets in San Francisco, are where the highest speeds typically happen. Drivers feel comfortable going faster on wide, straight, multi-lane streets.
It’s no surprise Fulton was chosen for speed cameras. This is a designated high-injury street with high numbers of traffic crashes. We have Walk SF members who live on Fulton who have witnessed many speed-related crashes on it.
Assessing driver speeds near Fulton’s speed camera
Fulton has two speed camera locations: between 42nd Avenue to 43rd Avenue, and between Arguello to 2nd Avenue.
Our speed survey focused on the stretch of Fulton on either side of the Arguello and 2nd Avenue camera location.
The speed camera at Arguello/2nd Avenue has been highly effective at changing driver behavior, reducing the share of drivers going more than 10mph over the speed limit by 59%. One of our members who lives right at this intersection says it is night and day with the speed camera there. Watch the short video of Will.
Late on a Saturday morning (with no major events at Golden Gate Park), we collected driver speeds at several locations near the speed camera:
- Schrader and Stanyan: ~.3 miles east of camera. NOTE: We didn’t do more locations to the east because Fulton becomes a two-lane street starting at Stanyan – an inherently different street design that slows speeds.
- 4th and 5th: ~.2 miles west of camera
- 8th and 9th: ~.4 miles west of camera
- 12th and Funston: ~.7 miles west of camera (near Park Presidio/ Highway 1)
- 14th and 15th: ~.8 miles west of camera (near Park Presidio/ Highway 1)
Here’s what we found:
- The highest average speeds were between 4th and 5th Avenues, just 2-3 blocks from the speed camera. We were surprised to see the highest average speeds at the location closest to the camera. The westbound traffic was faster than eastbound, with some terrifying outliers: we recorded one driver going 55mph, and another 56mph. If a driver is traveling west, after they pass the speed camera they face a wide, flat stretch of Fulton with no traffic light until 6th Avenue.
- The lowest average speeds were between Schrader and Stanyan, but the reason is unlikely camera proximity. This area is east of the speed camera, where Fulton Street has already become two lanes. We know that drivers don’t feel comfortable speeding when the roadspace is narrower and there is no way to pass other vehicles. There is also a traffic light at Stanyan and at Schrader – and these lights aren’t timed in a way to allow drivers to hit both as green and increase speeds.
- While most speeds surveyed at locations on either side of Park Presidio were around the speed limit, some dangerous speeding was observed. We recorded many drivers going high-30s to mid-40s between 12th and Funston as well as between 14th and 15th. This was especially the case between 14th and 15th westbound, where there are no upcoming lights on Fulton after the light at Park Presidio (similar to between 4th and 5th). Drivers on Park Presidio (which is a surface highway) are often going very fast and continue this after turning off of it, or drivers are hurrying to get onto Park Presidio.
Our speed surveyors also brought up good questions and observations:
- When do vehicle navigation systems alert drivers to speed cameras? Navigation systems like Google Maps tell drivers when a speed camera is ahead. Depending how far before the speed camera a system gives this warning, it could influence driver speeds for shorter or longer distances.
- What is the connection between red light running and speeding? Traffic lights (mostly) help keep driver speeds in check versus when there’s wide open roads. The exception is drivers racing to beat the traffic light, which is when some very dangerous speeds were seen. In San Francisco, our speed camera and red light cameras are separate programs. Outside of California, some cities combine these systems.
- Even 30mph feels very fast when you are in close proximity to a passing vehicle (and it is). Many volunteers commented on this – they were surprised to clock drivers going only five miles above the limit given how they felt. But this goes to the heart of the matter on why speed is so dangerous. For every mile faster a driver goes, the threat rises quickly. Doubling a car’s speed quadruples its kinetic energy, making the stakes increasingly high above 25 mph. By 40 mph, about 75% of pedestrians will suffer a life-threatening injury or die if hit (and this is higher as the vehicle’s weight and size increase).
San Francisco needs more speed cameras to shift driver behavior at the scale needed
While our speed survey on Fulton Street was just one small sample on one day, it does offer some insights on how the effect of speed cameras on driver behavior beyond the camera location itself is quite limited.
This speaks to the need for San Francisco’s speed camera program to expand to meet the threat of rampant speeding citywide. On streets like Fulton, speed cameras must be frequent enough to keep drivers consistently in check.
And of course street design itself is crucial, which the data illustrated. Wide roads invite drivers to go too fast, while fewer lanes plus traffic lights, help keep drivers in check.
We need safe speeds to be the norm, not the exception. That means redesigning wide streets like Fulton to discourage speeding and fully harnessing the proven solution of speed cameras.
Walk SF has already started the groundwork to pass a new state law to allow San Francisco to expand and make permanent its speed camera program, plus let other cities harness this lifesaving technology. And you can help right now!
- Tell San Francisco leaders that you want more speed cameras. Send a quick email now.
- Support Walk SF’s work to win solutions to address dangerous speeding. Donate now.
Thank you to Families for Safe Streets for hosting this speed survey and for being long-time champions of speed cameras with Walk SF. Thanks to everyone who helped do the speed survey, and to the Department of Public Health for its support of this work!
Banner image: Liz Spielman